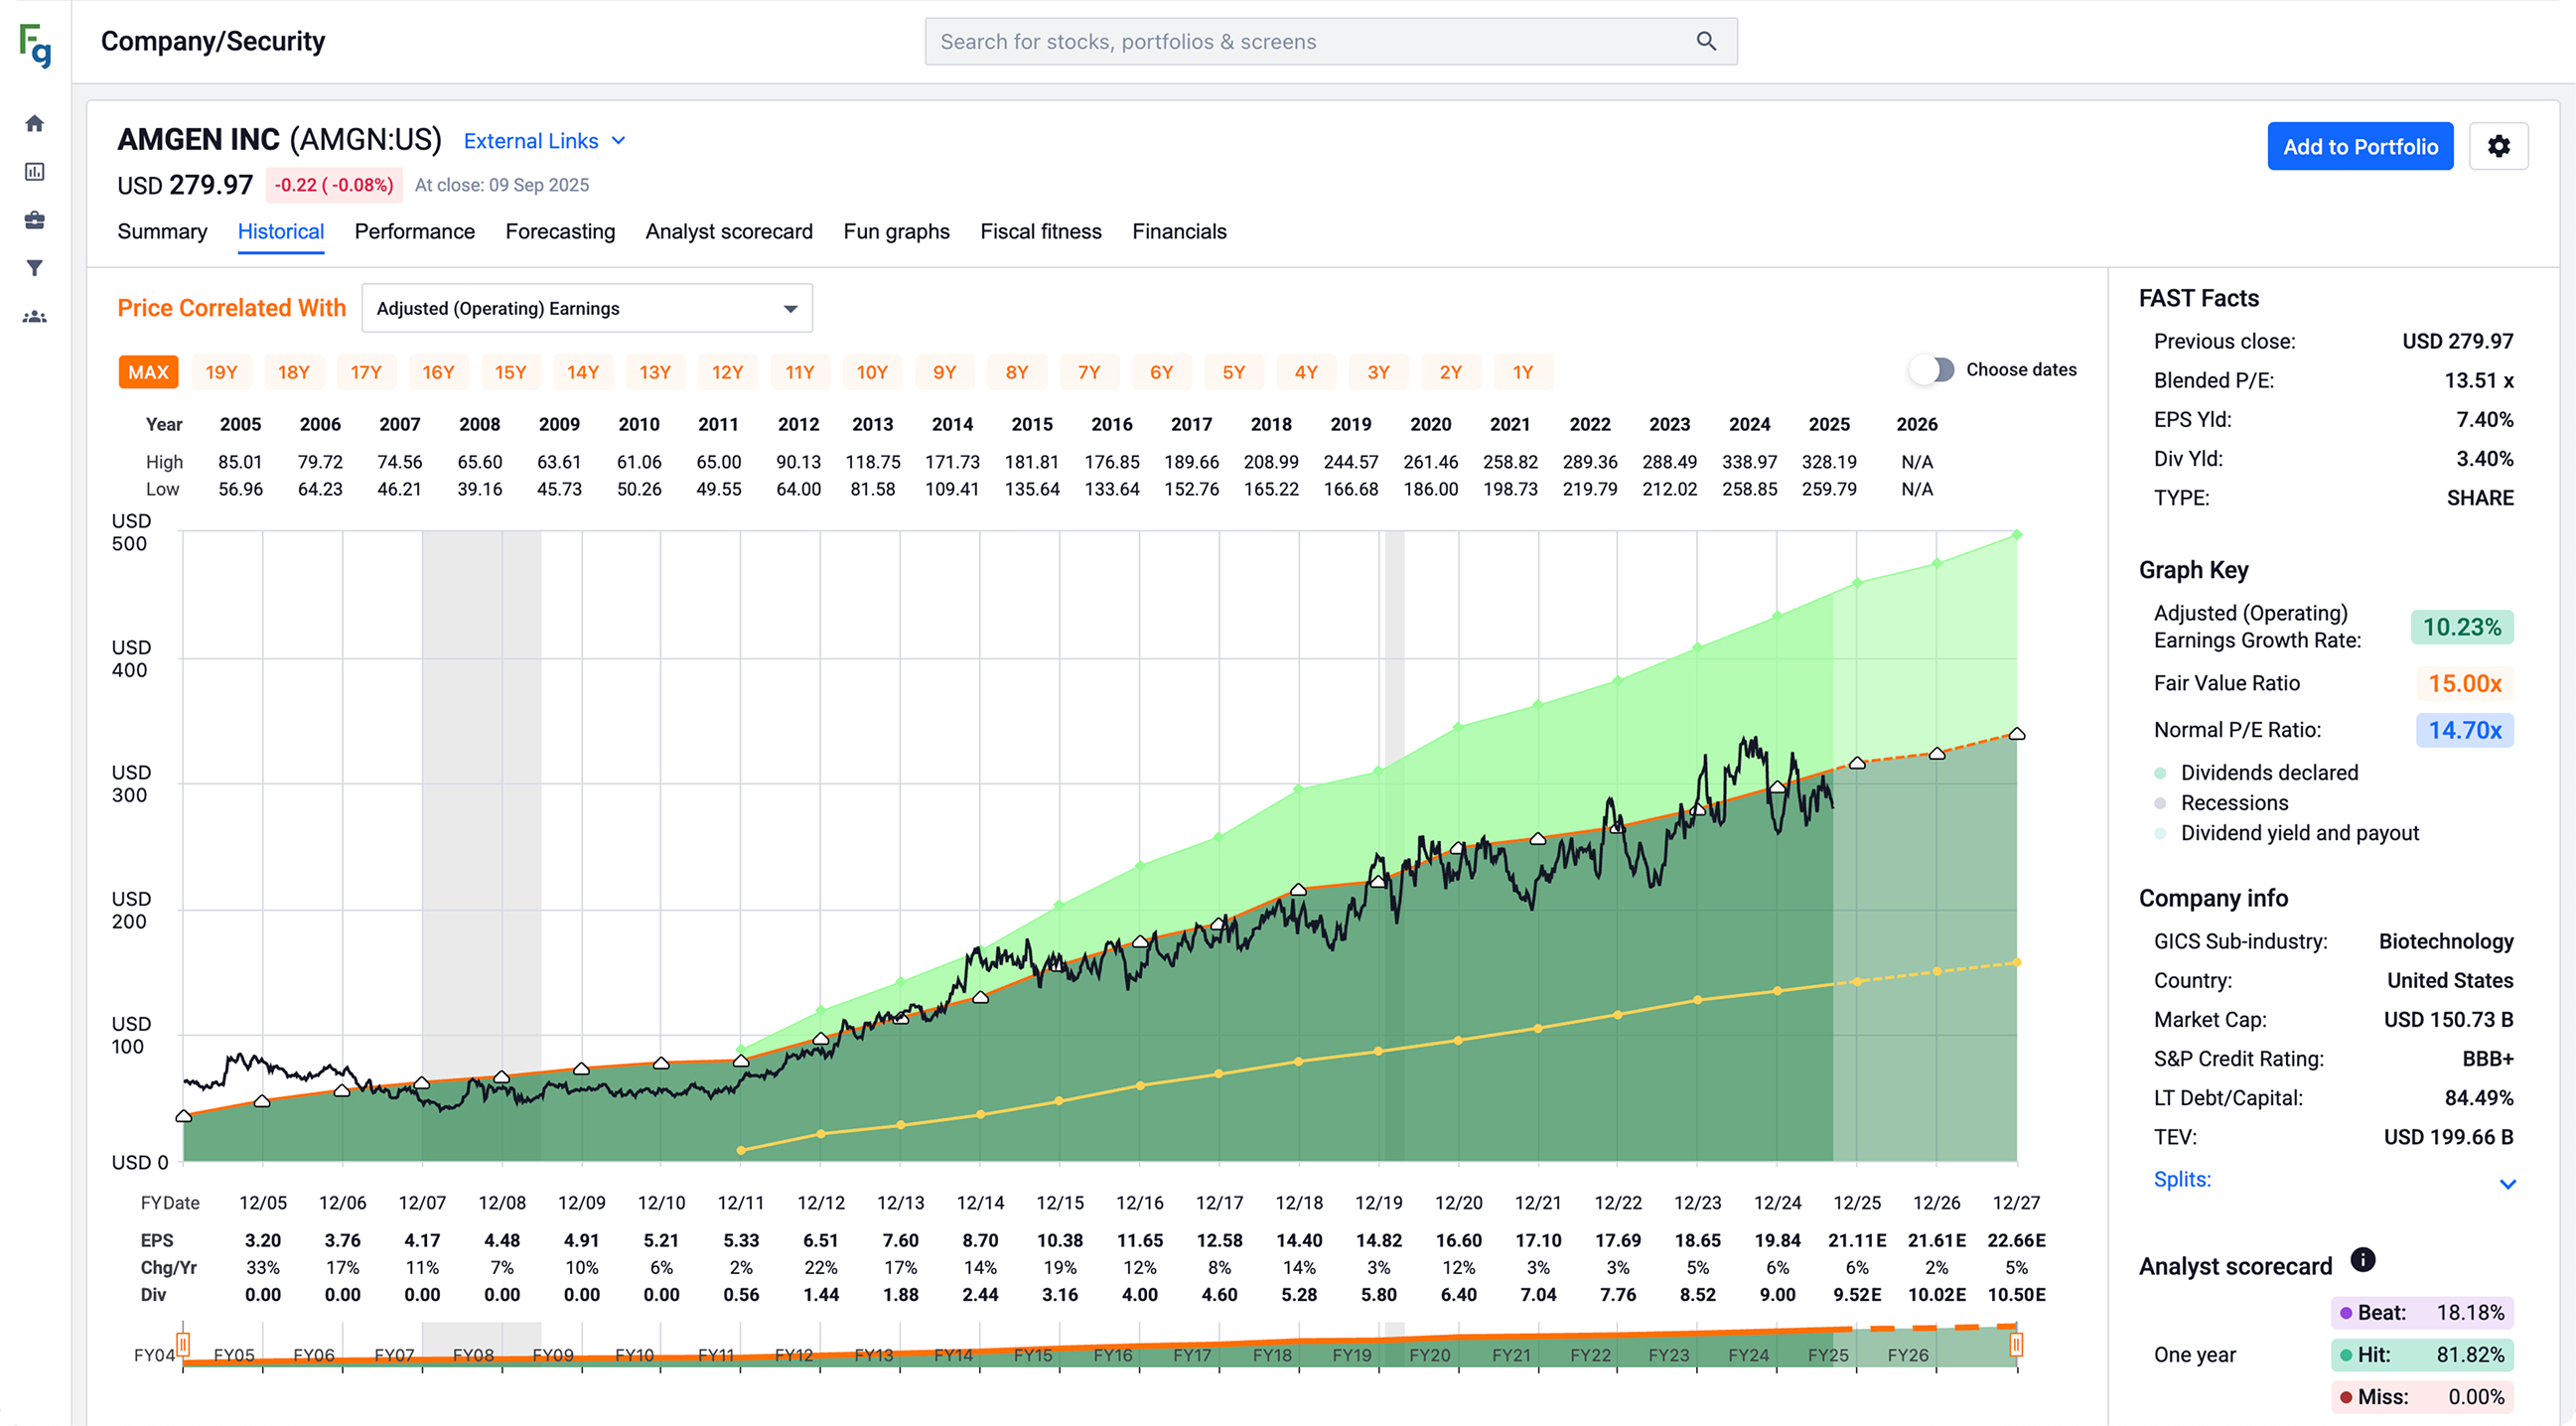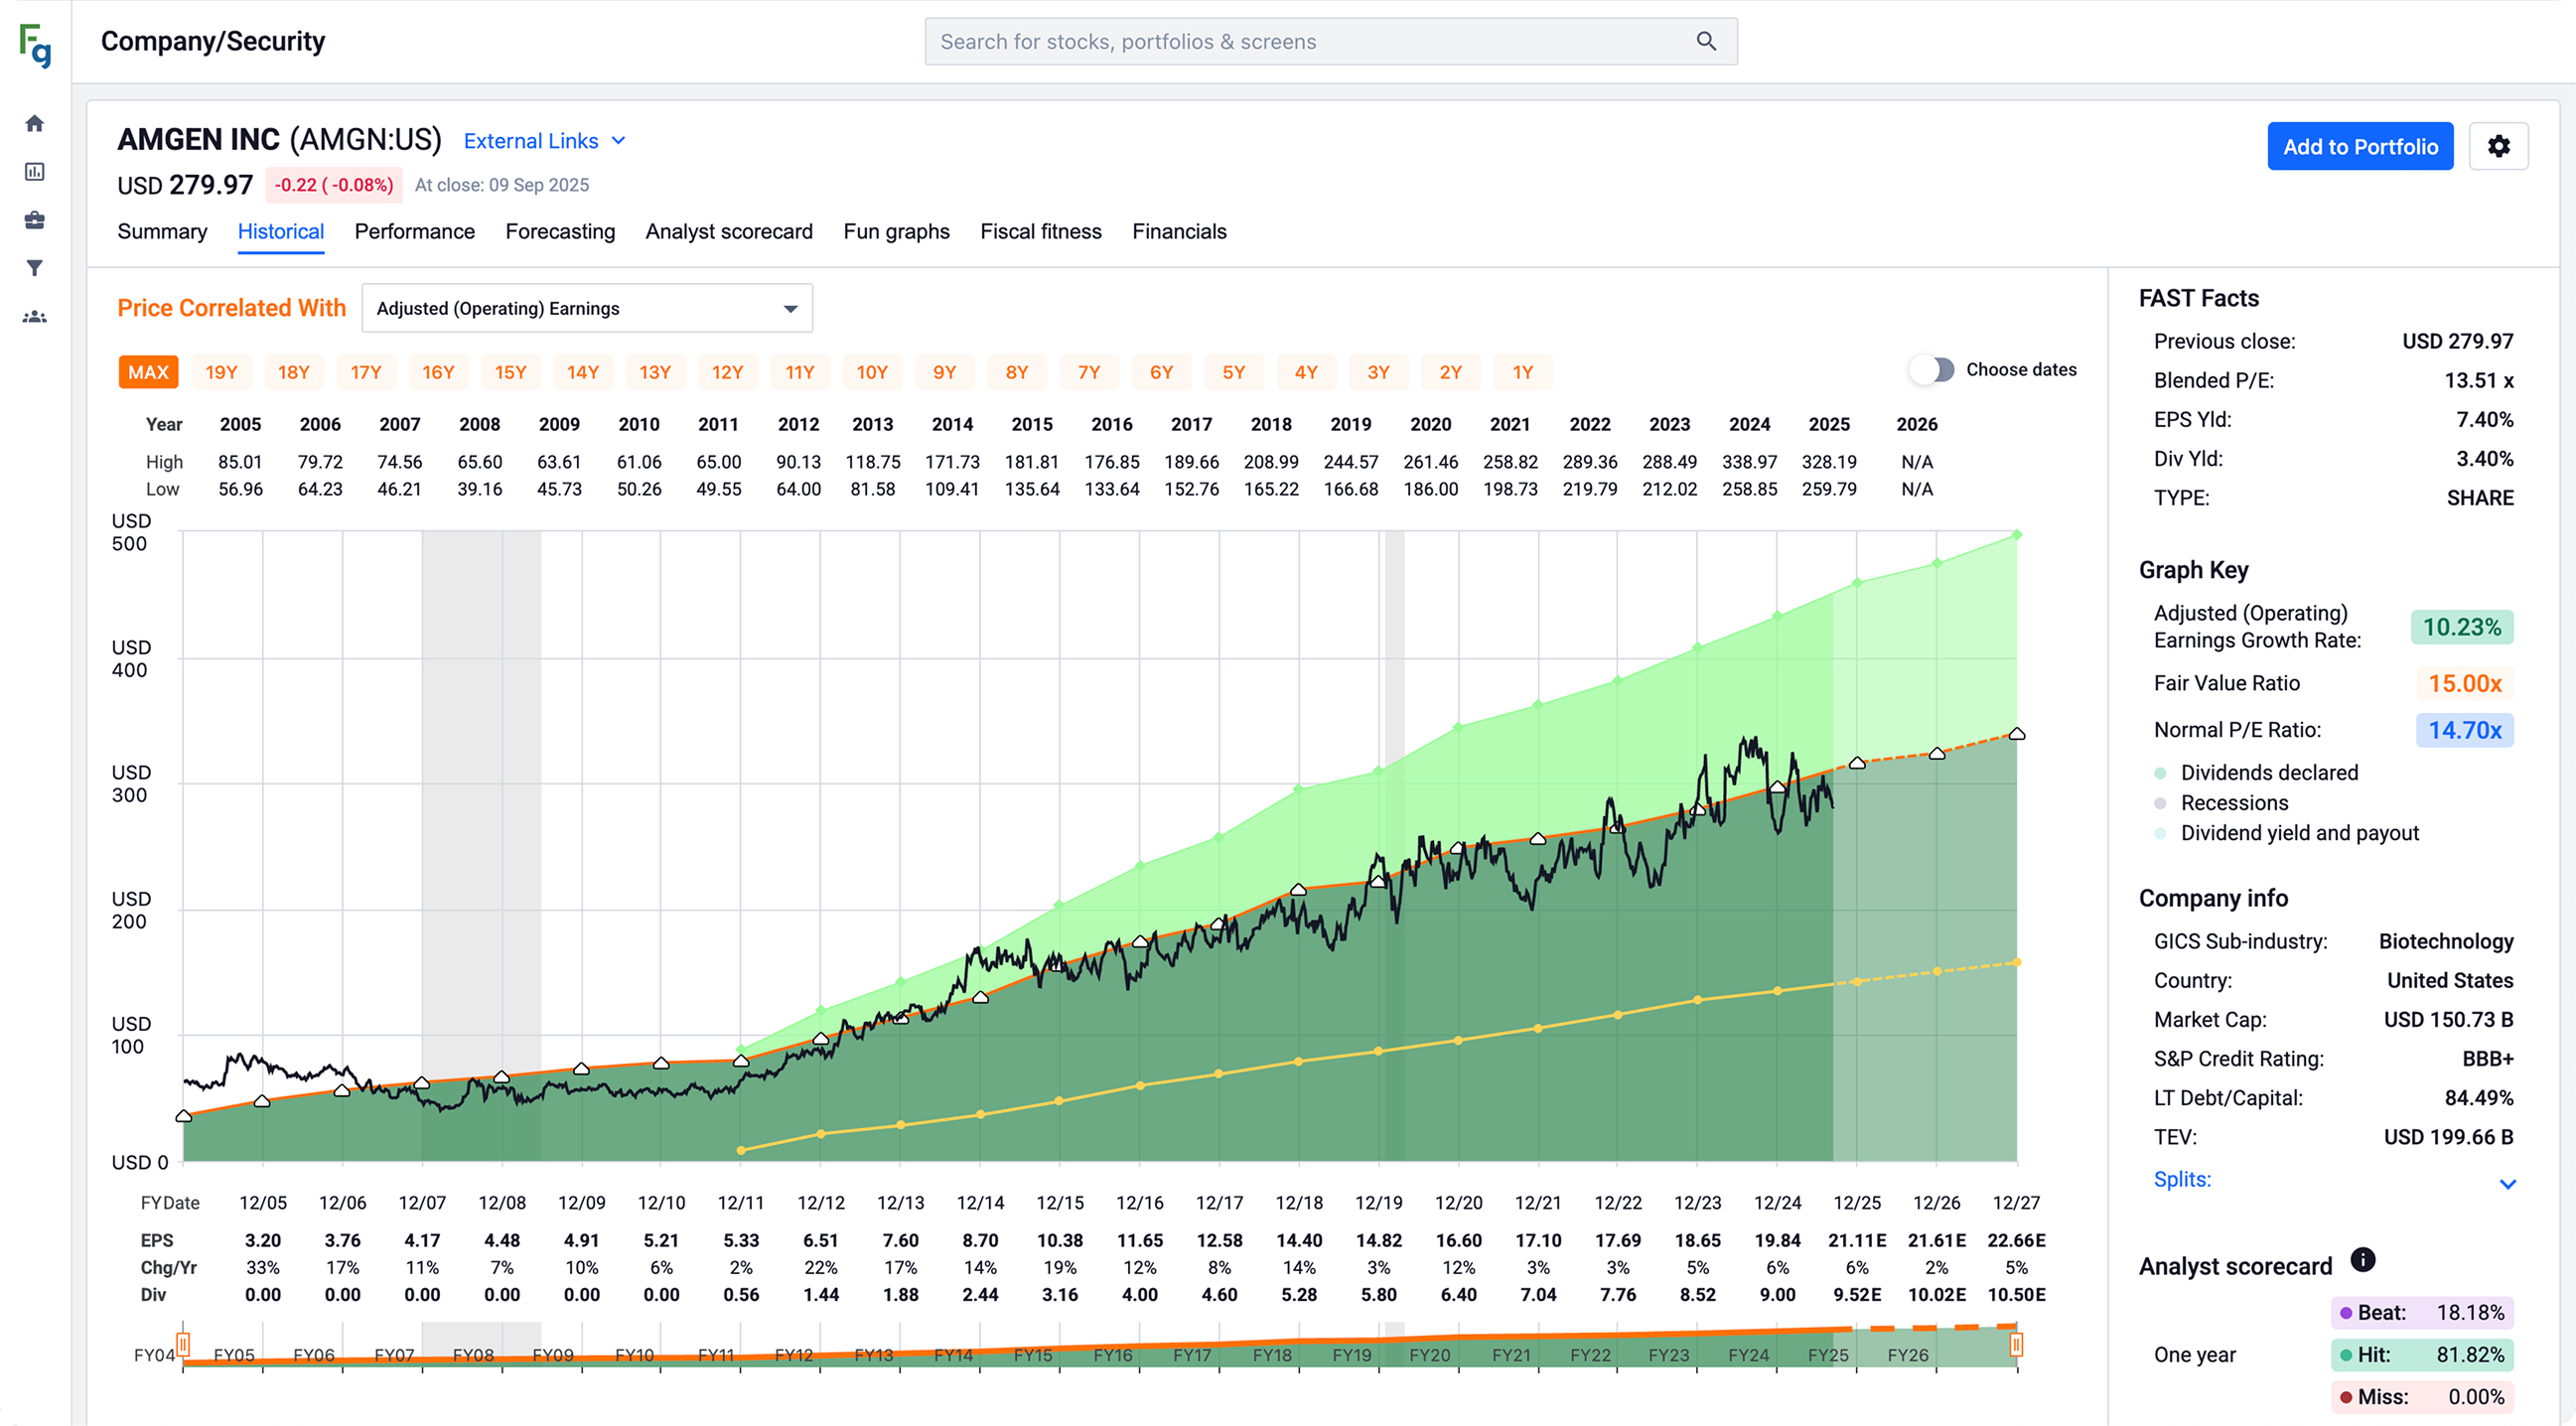
I’ve read enough investing books to know the theory — buy quality at a fair price — but actually judging whether a stock is cheap or expensive relative to its own earnings history is tedious. FAST Graphs is a tool that’s been quietly popular with value and dividend investors for exactly this, so I dug into how it works and whether it earns its subscription. Quick note up front: this is a review of a research tool, not investment advice.
1. What Is FAST Graphs?
FAST Graphs (“Fundamentals Analyzer Software Tool”) is a stock analysis platform built for value investors. Its signature move is overlaying a company’s fundamentals — earnings, cash flow, dividends — against its stock price on a single chart, so you can quickly see whether shares are trading above or below what the fundamentals justify. The pitch is “forecast with reason, not emotion”: turn raw financial data into a clear picture of valuation, growth, and performance over time.
2. Who Is FAST Graphs Best For?
✅ Value and dividend investors
If you care about buying quality companies at reasonable valuations, the fundamentals-vs-price chart is exactly the lens you want, and it’s the tool’s core strength.
✅ Long-term, buy-and-hold investors
The forecasting calculators and historical context reward people thinking in years, not days — it’s built around discipline, not day-trading.
✅ Investors who want to screen faster
Prebuilt screens, advanced filtering, and comparisons help you narrow a watchlist to companies worth deeper research.
❌ Active traders and chartists
FAST Graphs is about fundamentals and valuation, not technical trading signals. Short-term traders won’t find their toolkit here.
❌ Complete beginners with no grasp of fundamentals
Terms like P/E, earnings growth rate, and valuation multiples assume some background. Learn the basics first, or the charts won’t mean much.
3. Core Features Breakdown
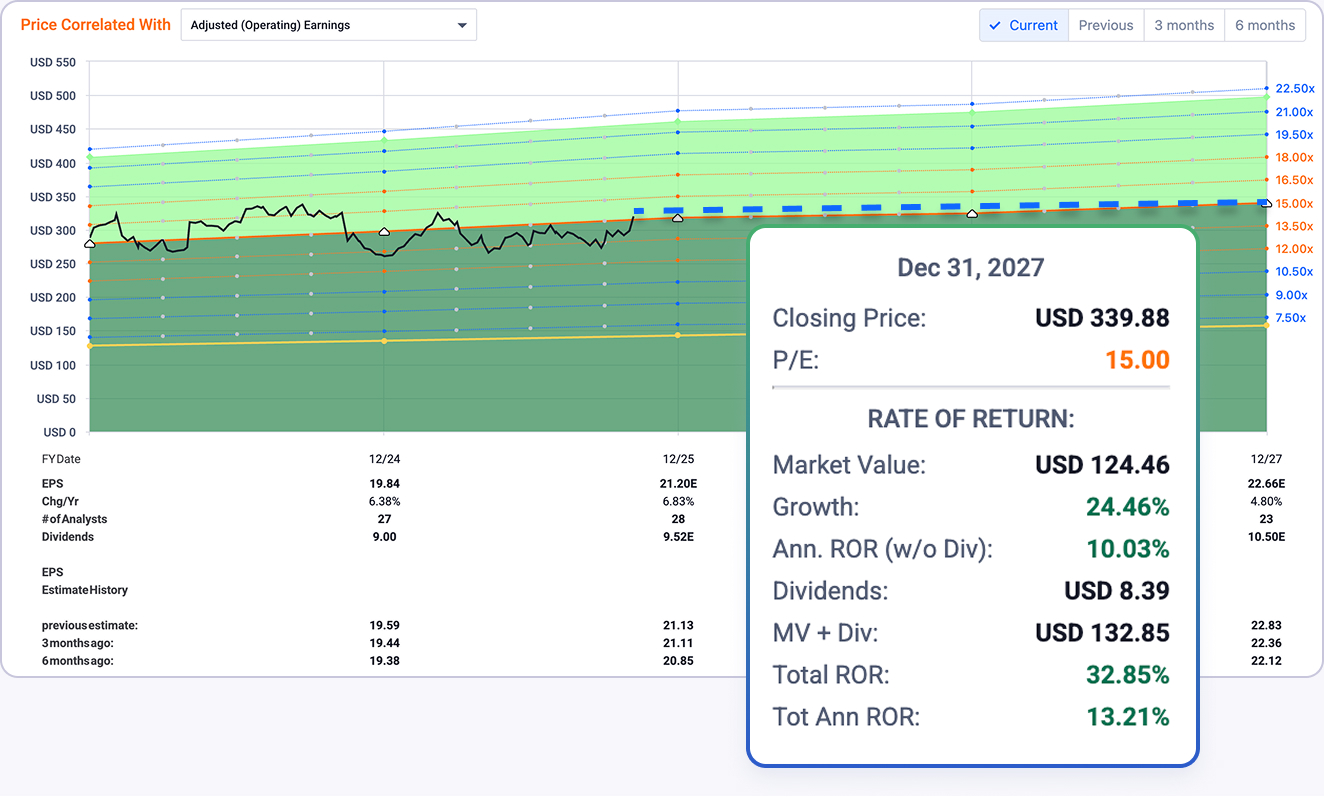
3.1 Fundamentals-vs-price charts
The heart of the tool: a visual overlay of earnings and fundamentals against price. At a glance you can see whether a stock looks overvalued, undervalued, or fairly priced relative to its own history.
3.2 Forecasting calculators
Project potential returns based on analyst estimates and different growth assumptions. It frames expectations with reason rather than hype — useful for setting realistic targets.
3.3 Screening and comparisons
Prebuilt screens, advanced filtering, and side-by-side comparisons let you find and contrast candidates efficiently, plus analyst estimates and accuracy tracking.
3.4 Portfolio analysis
Portfolio tools built for value discipline help you see whether your holdings still align with your valuation criteria and how they’ve performed in context.
4. Pricing
FAST Graphs offers a free trial plus two paid tiers, with about 17% off on annual billing. Here’s what I saw (confirm current numbers on their site):
- Free trial — $0.00/month, no credit card needed. Try the summary page, historical and performance charts, forecasting calculators, and basic features.
- Basic — $15.95/month (billed annually). Adds basic portfolios, transactions, and presets for regular use.
- Premium — $40.00/month (billed annually). Full access to the more advanced valuation, screening, and portfolio tools.
Starting with the no-card free trial is the smart move — you can see whether the fundamentals-first approach fits how you invest before paying.
5. Pros & Cons
Pros: Uniquely clear fundamentals-vs-price visualization; strong for value and dividend investing; forecasting grounded in estimates; solid screening and comparison tools; portfolio analysis; free trial with no credit card; reasonable Basic price.
Cons: Not for active traders or technical analysis; assumes fundamentals knowledge; cheapest prices require annual billing; Premium at $40/month is a real commitment for casual investors.
6. FAST Graphs vs Simply Wall St
Simply Wall St is a popular alternative known for visual “snowflake” infographics and beginner-friendly summaries. FAST Graphs is more analytical and history-focused, prized by experienced value investors for its earnings-vs-price clarity and forecasting. If you want approachable visuals and a gentle on-ramp, Simply Wall St is friendly. If you want a rigorous, valuation-first tool, FAST Graphs is the deeper instrument. Use the free trial to see which style matches how you actually make decisions.
7. Final Verdict: Is FAST Graphs Worth It in 2026?
For value and dividend investors, FAST Graphs is a genuinely useful tool in 2026 — few products make valuation this visual and fast to assess. Start with the free, no-card trial, move to Basic ($15.95/month) for everyday use, and step up to Premium if you need the full screening and portfolio suite. It won’t suit traders, and it assumes some fundamentals literacy — but for its intended audience, it earns its keep. Just remember it’s a research tool, and every investment decision remains your own.
Frequently Asked Questions
Is there a free trial of FAST Graphs?
Yes. There’s a free trial at $0.00/month with no credit card required, so you can test the charts and calculators before subscribing.
What makes FAST Graphs different?
Its signature feature overlays a company’s fundamentals (earnings, cash flow, dividends) against its stock price on one chart, making valuation easy to judge at a glance.
How much does FAST Graphs cost?
Basic is $15.95/month and Premium is $40.00/month, both billed annually (about 17% off versus monthly). A free trial is available.
Is FAST Graphs good for beginners?
It’s best for those who understand basic fundamentals like P/E and earnings growth. Beginners should learn those concepts first to get full value from the charts.
Does FAST Graphs give buy or sell recommendations?
No. It provides data, valuation context, and forecasting tools to inform your own analysis, not specific investment advice or signals.
👉 Where to Get FAST Graphs
You can try FAST Graphs here: Try FAST Graphs. Start with the free, no-credit-card trial and upgrade only if the fundamentals-first approach fits your style.
Affiliate disclosure: This post contains an affiliate link. If you sign up through it, I may earn a commission at no extra cost to you. All opinions are my own. This article is for informational purposes only and is not financial or investment advice. Investing involves risk, including possible loss of principal — always do your own research (DYOR) and consider consulting a licensed advisor.